Fed releases
Fed press release: 2025 Survey of Consumer Finances results
The Fed's 2025 Survey of Consumer Finances puts median family income at $82,200 and median net worth at $215,900, with more families carrying heavy debt loads.
- Fed funds target
- 3.75–4.00%
- 2-year Treasury
- 4.80%
- 10-year Treasury
- 5.24%
- 30-year mortgage
- 7.40%
The news: The Federal Reserve Board released results of the 2025 Survey of Consumer Finances on Friday, along with a summary report titled Changes in U.S. Family Finances from 2022 to 2025. The current version of the survey has run every three years since 1989 and describes what Americans own, how much they borrow and how they bank, according to the Fed press release.
By the numbers:
- Real median family income rose 7 percent to $82,200; real mean income fell 6 percent to $145,200.
- Real median net worth rose 2 percent to $215,900; real mean net worth rose 7 percent to $1.24 million.
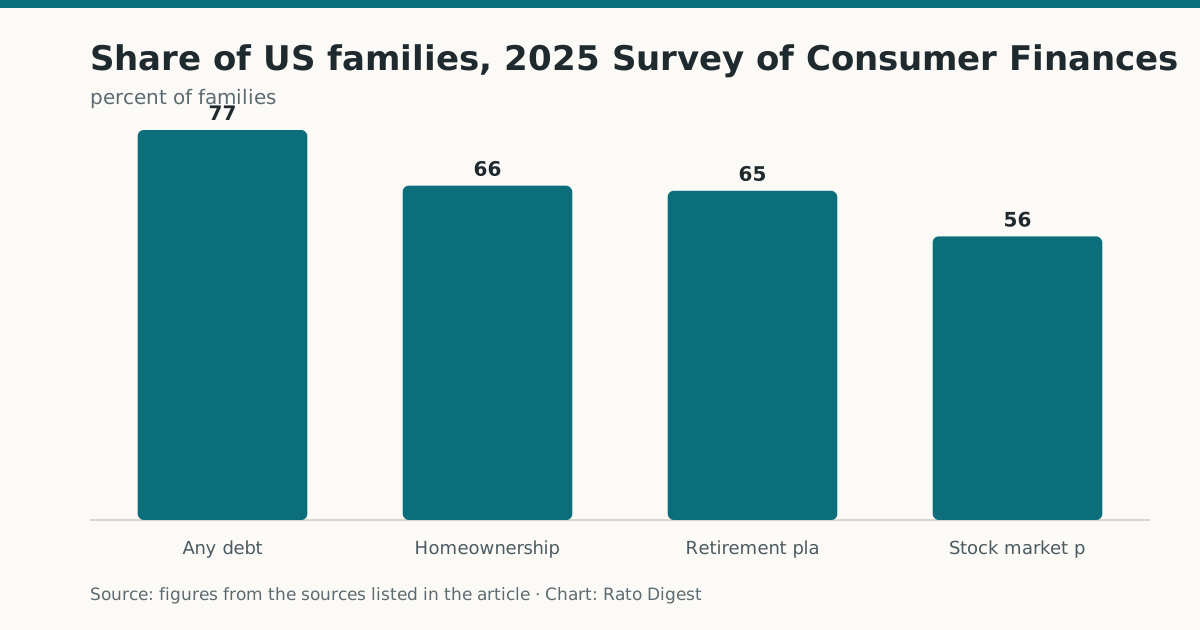
- Homeownership: 66 percent, about unchanged; median net housing value $230,000, up from $218,900.
- Stock market participation: 56 percent, down from 58 percent; median holdings among holders up 36 percent to $77,400.
- Families with debt payments above 40 percent of income: 8.6 percent, up from 6.5 percent.
Why it matters: The income figures split by position in the distribution. Families at the lower end saw modest increases in median and mean income, while those at the upper end saw declines, which helps explain how median income rose while the mean fell. Most families across the net worth and income distributions saw gains in median and mean wealth.
Retirement plan participation was up slightly to around 65 percent, with higher mean and median balances for families holding account-type plans. About 77 percent of families carried debt, a share that was stable, and median and mean debt outstanding were unchanged from 2022.
The weak spot is the group with heavy payment burdens. The share of families with debt payment-to-income ratios above 40 percent rose from 6.5 to 8.6 percent, a level last seen in the 2013 survey.
The big picture: Because the survey is repeated every three years, the 2022-to-2025 comparison offers a consistent read on household balance sheets over a period that included high interest rates. The Board also published an interactive chartbook and researcher data files.
What’s next: Researchers will use the data files for further analysis. The survey is conducted for the Board by NORC at the University of Chicago, using a random sample drawn from 119 geographic areas.
Prepared with AI assistance from the documents listed in the margin and reviewed under our editorial policy. Not investment advice.